CovidExpress Server
(Server would sleep if no access within 30mins, please wait and refresh)
What’s New
- 2021-10-08 Put up Video Tutorials
- 2021-10-06 Setup Gitter Channel for bug report, new study suggestion, et.al
- 2021-08-04 Added protocol information to meta data. Add “Split by”, “Group by” function to heatmap
- 2021-07-07 Poster presented at CSHL conference “COVID/SARS CoV2 Rapid Research Reports #6”
- 2021-06-12 > 300 Vistors
- 2021-05-26 Update biorxiv version for figures
- 2021-05-18 Added DEG volcano plot, improved memory usage
- 2021-05-16 biorxiv submission accepted
- 2021-05-12 Start running at digitalocean
- 2021-05-08 Deposit app to heroku and digitalocean
- 2021-05-02 Improved GSEA run time by numba, add GSEA volcano plot
- 2021-04-29 Finalized GSEA results, improved GSEA results storage usage
- 2021-04-25 GSEA module ready
- 2021-03-17 Visualization module Ready
- 2021-03-12 Extracted gene clouds
- 2021-03-10 Landing page framework finalized at github.io
- 2021-02-24 Test idea PCA/tSNE/UMAP using ssGSEA score
- 2021-02-12 Finalized QC criterion
- 2021-01-20 Expand data to ~1500 samples
- 2020-11-17 Started data download and processing ~700 samples
Overview
CovidExpress: an interactive portal for intuitive investigation on SARS-CoV-2 related transcriptomes
Abstract


Infection with severe acute respiratory syndrome coronavirus 2 (SARS-CoV-2) in humans could cause coronavirus disease 2019 (COVID-19). Since its first discovery in Dec 2019, SARS-CoV-2 has become a global pandemic and caused 2.8 million direct/indirect deaths (2021 Apr). Amongst the scientific community’s response to COVID-19, data sharing has emerged as an essential aspect of the combat against SARS-CoV-2. Despite the ever-growing studies about SARS-CoV-2 and COVID-19, to date, only a few databases were curated to enable access to gene expression data. Furthermore, these databases curated only a small set of data and do not provide easy access for investigators without computational skills to perform analyses. To fill this gap and advance open-access to the growing gene expression data on this deadly virus, we collected about 1,500 bulk RNA-seq datasets from publicly available resources, developed a database and visualization tool, named CovidExpress (https://stjudecab.github.io/covidexpress). This open access database will allow research investigators to examine the gene expression in various tissues, cell lines, and their response to SARS-CoV-2 under different experimental conditions, accelerating the understanding of the etiology of this disease in order to inform the drug and vaccine development. Our integrative analysis of this big dataset highlights a set of commonly regulated genes in SARS-CoV-2 infected lung and nasal tissues, including OASL that were under-studied in COVID-19 related reports. Our results also suggested a potential FURIN positive feedback loop that might explain the evolutional advantage of SARS-CoV-2.
Portal Usage
- Learn about cellxgene basical functions
- Video Tutorial: CovidExpress Differential Expressed Gene(DEG) analysis feature
-
Video Tutorial: CovidExpress Gene Set Enrichment Analysis(GSEA) feature
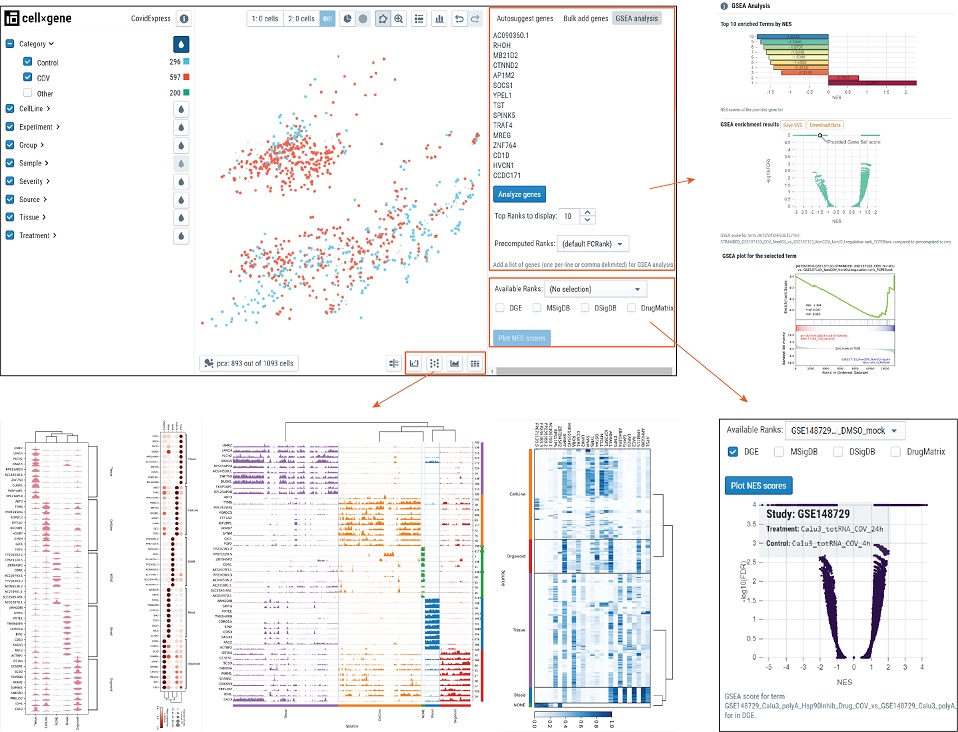
- Below illustrated the functional plugins we developed to help visualzation and analysis.
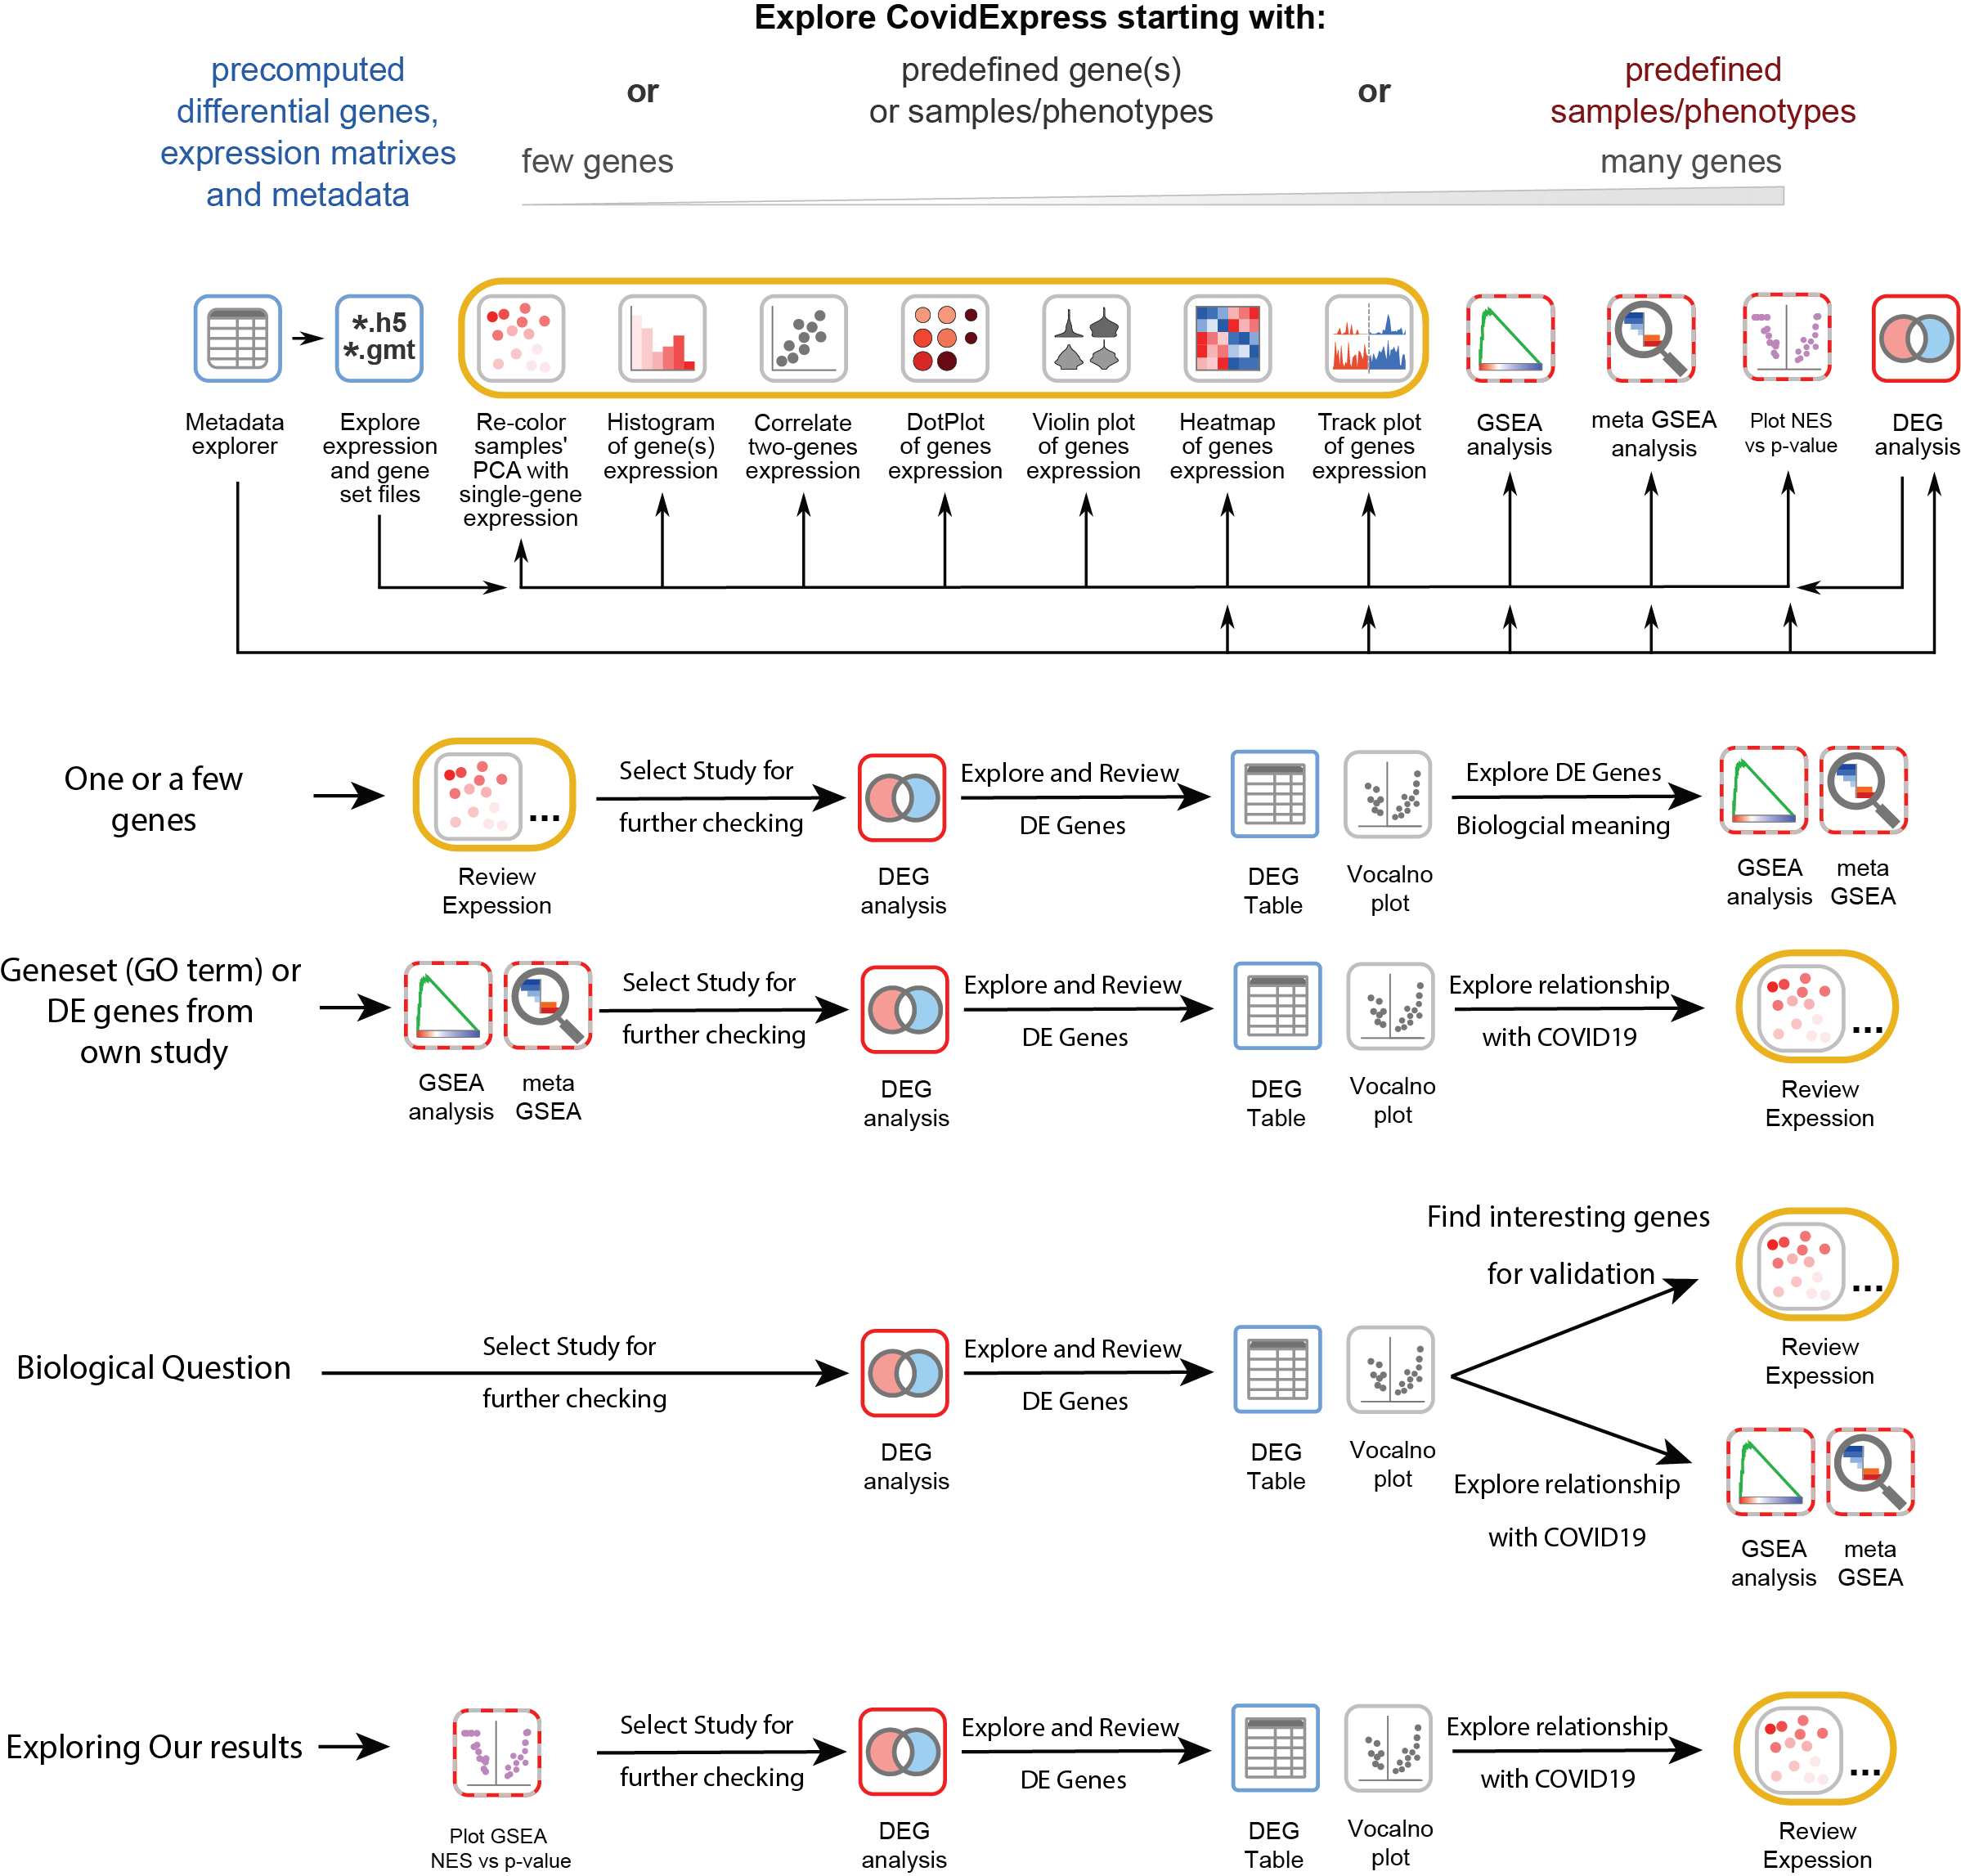
Suggested Analysis Steps
CovidExpress Metadata Explorer
We used jquery dataTable so you could explore the meta data easily. Open explorer page
CovidExpress Expression Data Download
h5ad file is a HDF5 format with annotation commonly used for single cell data. Learn more about h5ad file.
Download h5ad file for expression (~350Mb)
Download GMT file for genesets from our and others’ analysis(~30Mb) so you could perform GSEA analysis using your own data.
Clustering Results for reviewing and Download
(see below tables for details)
| Score | ssGSEA | ssGSEA | ssGSEA | TPM | TPM | TPM |
|---|---|---|---|---|---|---|
| Data | COV.Significant | COV.All.Signature | MSigDB | CombinedDiff | BatchCorrected | Original |
| PCA.3D | Open | Open | Open | Open | Open | Open |
| PCA.2PCs | Open | Open | Open | Open | Open | Open |
| PCA.grid | Open | Open | Open | Open | Open | Open |
| PCA.components_matrix | Download tsv | Download tsv | Download tsv | Download tsv | Download tsv | Download tsv |
| PCA.loadings | Download tsv | Download tsv | Download tsv | Download tsv | Download tsv | Download tsv |
| PCA.loadings_matrix | Download tsv | Download tsv | Download tsv | Download tsv | Download tsv | Download tsv |
| tSNE.3D | Open | Open | Open | Open | Open | Open |
| tSNE.2nc | Open | Open | Open | Open | Open | Open |
| UMAP.3D.n_neighbors_20 | Open | Open | Open | Open | Open | Open |
| UMAP.3D.n_neighbors_10 | Open | Open | Open | Open | Open | Open |
| UMAP.3D.n_neighbors_5 | Open | Open | Open | Open | Open | Open |
| Column/Row | Meaning |
|---|---|
| Score:ssGSEA | Clustering using single-sample Gene Set Enrichment Analysis Score (ssGSEA) |
| Score:TPM | Clustering using expression value Transcripts Per Million(TPM) |
| Data:COV.Significant | ssGSEA score were using genesets from pre-computed differential analysis(Using Voom), only genes significant(fold change > 2, False Discovery Rate corrected p-value < 0.05) were considered for each differential analysis. |
| Data:COV.All.Signature | ssGSEA score were using genesets from pre-computed differential analysis(Using Voom), genes passed different levels of cutoff or top regulated genes were all considered for each differential analysis. |
| Data:MSigDB | ssGSEA score were using genesets from Molecular Signatures Database(MSigDB) |
| Data:Original | TPM values from RSEM method(Li and Dewey,2011,BMC Bioinformatics) using STAR(Dobin et al,2013,Bioinformatics) |
| Data:CombinedDiff | Only used TPM values for top1000 differential expressed genes from COV Signature(Union) |
| Data:BatchCorrected | TPM values were corrected for batch effect using Combat(From SVA R package, Johnson et al,2007,Biostatistics) |
| – | |
| PCA.3D | Three dimensions plot(PC1 vs PC2 vs PC3) from Principal component analysis |
| PCA.2PCs | Two dimensions plot(PC1 vs PC2) from Principal component analysis |
| PCA.grid | Two dimensions plots(Many vs Many) from Principal component analysis |
| PCA.components_matrix | Each sample’s projection to top principal components |
| PCA.loadings | PCA loading as each geneset or gene’s loading to top principal components |
| PCA.loadings_matrix | PCA loading matrix as each geneset or gene’s correlations to top principal components |
| tSNE.3D | Three dimensions plot from tSNE analysis |
| tSNE.2D | Two dimensions plot from tSNE analysis |
| UMAP.3D.n_neighbors_20 | Three dimensions plot from UMAP analysis using parameter n_neighbors = 20 |
| UMAP.3D.n_neighbors_10 | Three dimensions plot from UMAP analysis using parameter n_neighbors = 10 |
| UMAP.3D.n_neighbors_5 | Three dimensions plot from UMAP analysis using parameter n_neighbors = 5 |
FAQs
Where can I find more details
More details could be found in our pre-print BIORXIV/2021/444026
Will the database been updated?
Yes, we plan to update the database either Quarterly or if we found 10 new studies from public resources. Suggestion of new studies is welcome and appreciated, simple Email Us or let us know in Our Gitter Channel
Can I compare samples from different studies?
We strongly recommend only compare samples from the same study. Our ssGSEA approach mainly aimed at help visual so investigator could find the samples easier, but not able to overcome the batch effect. We tried batch effect correction methods such as Combat, sva, Combat-seq, quantiles normalization, they indeed reduced the batch effect. However, for many published studies, we failed reproduce the top reported genes using the corrected expression values. Thus we decided provide original TPM values as log2(TPM+1). We are investigating more on this topic and might update later if we found better solution allow meta studies.
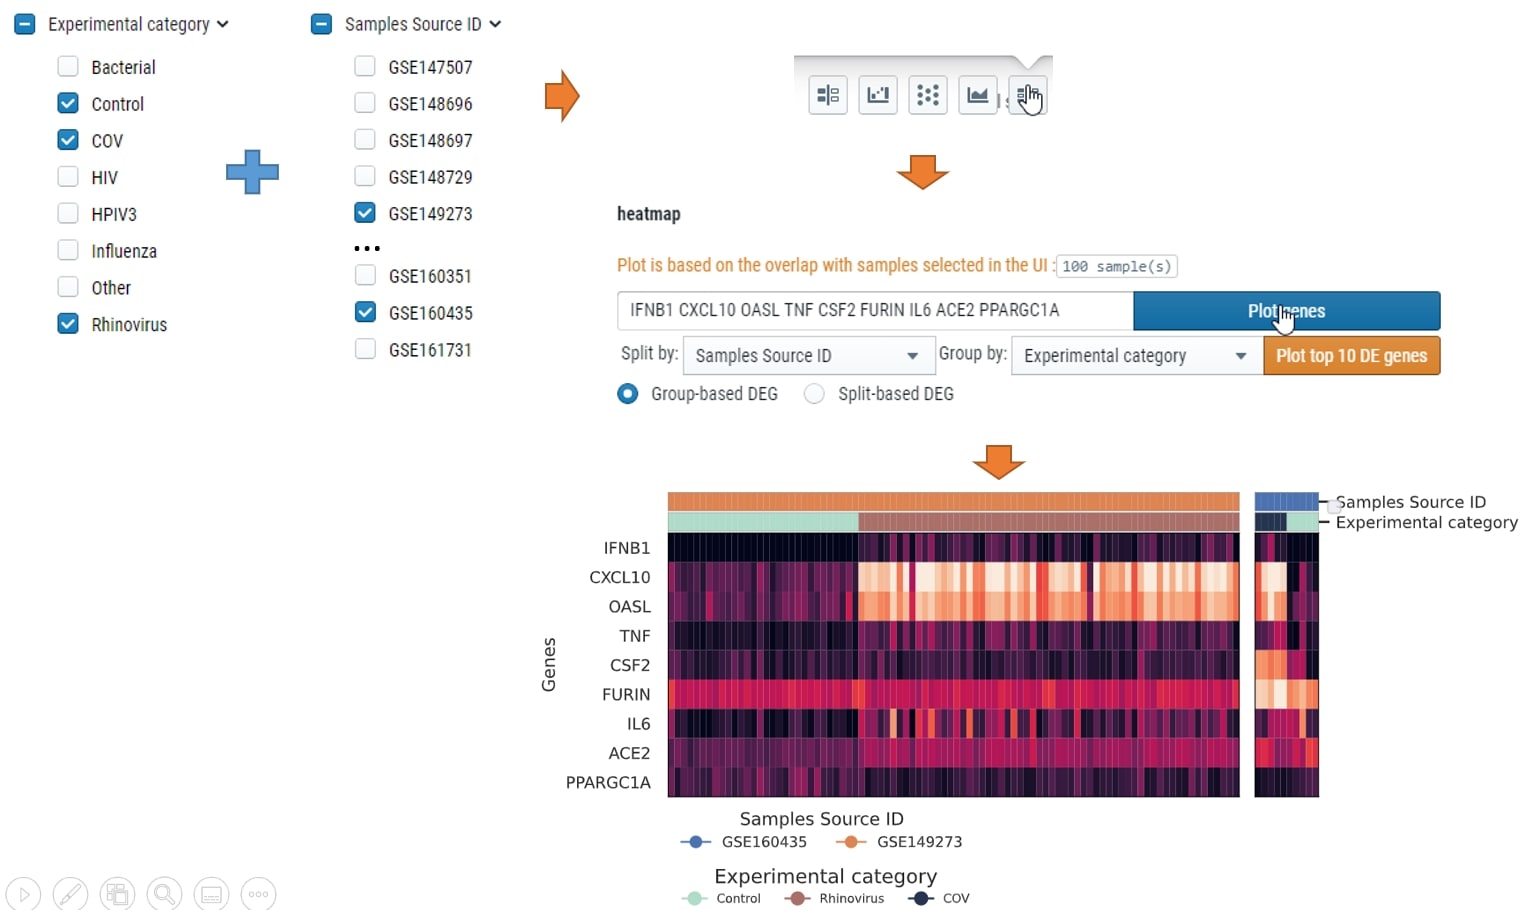
How can I plot heatmap compare within group
You could select the samples by checkbox on the left, then choose which meta data to split by and which meta data to group by. see below for example:
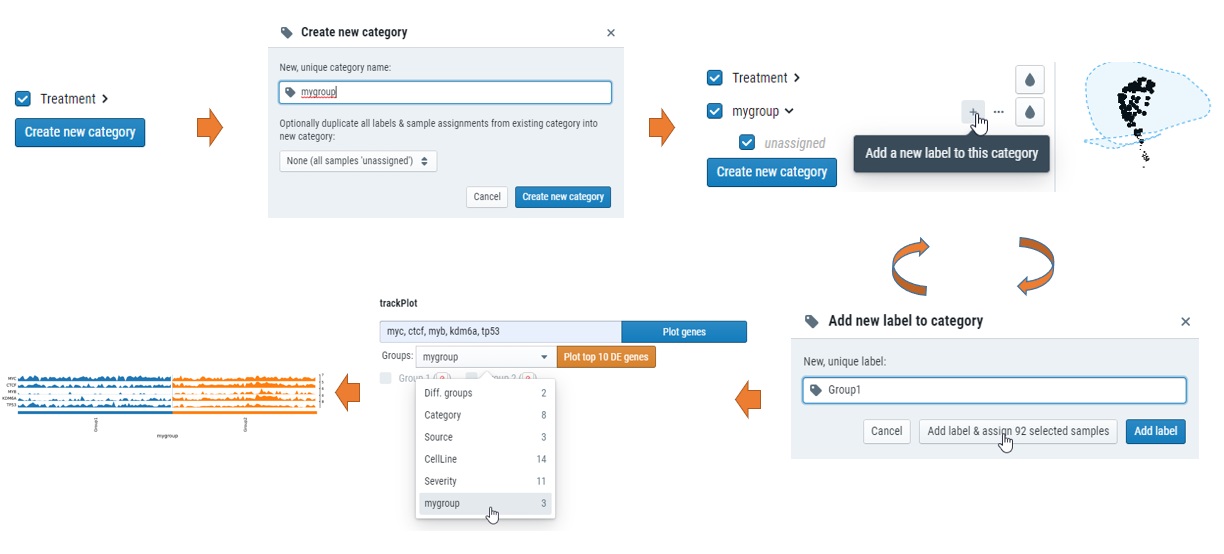
How can I custimize my own groups for plots?
Simple click “creat new category” on the left, select the samples and add to new groups. see below.
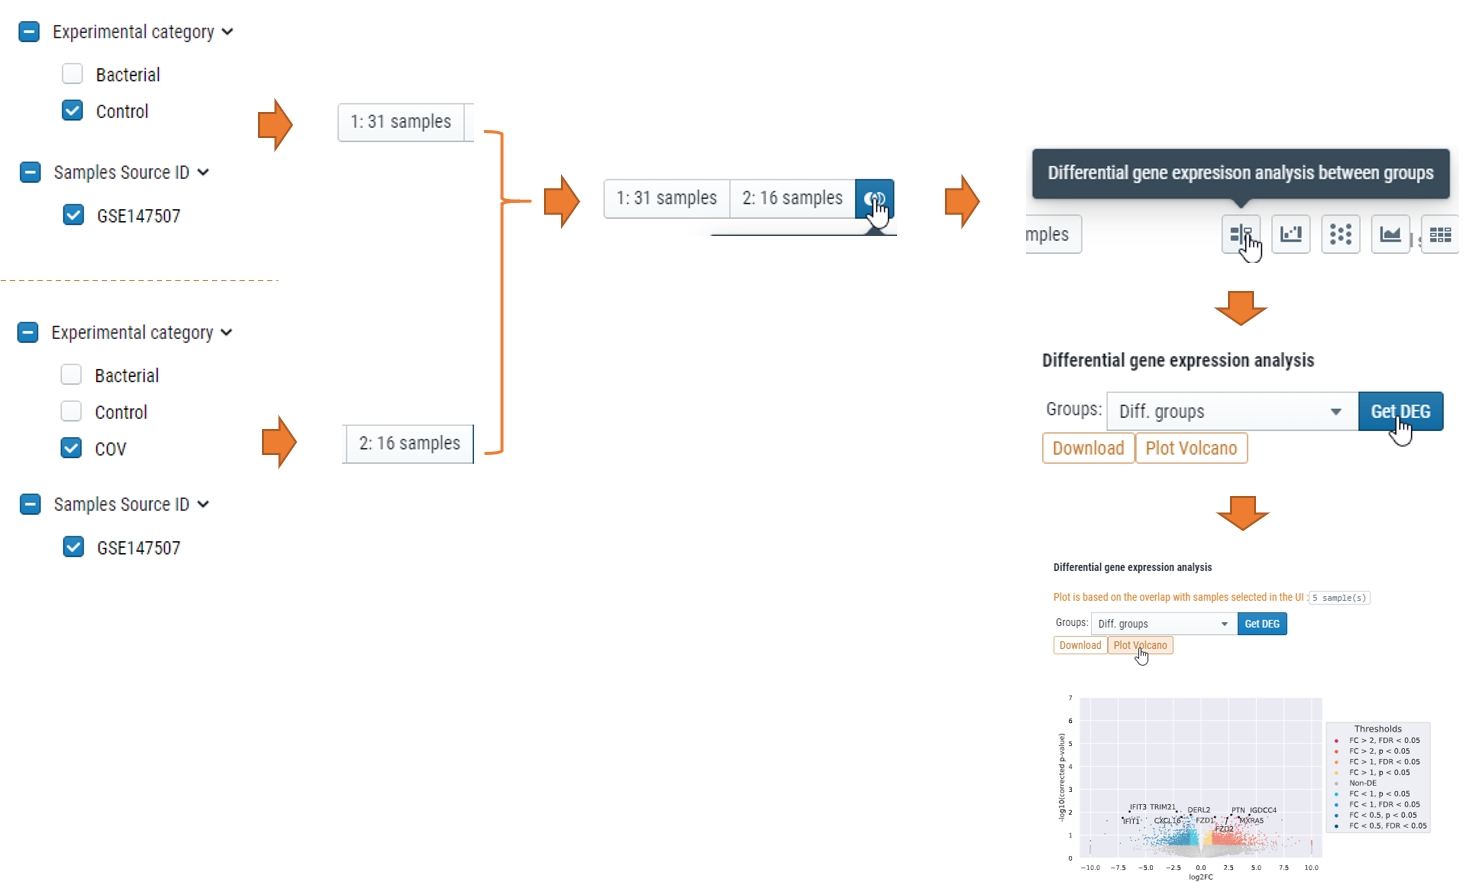
How can I get differential expressed genes(DEG) results and Volcano plot?
You could select the samples by checkbox on the left or lasso and put them into either group 1 or group2, and then compare, see below for steps.
More…
What does “Diff. groups” mean in “Split by” or “Group by” meta data
Those were the samples you selected either checkbox or lasso function after you click “1:” or “2:” for differential expression analysis. For details, check “Compare expression of multiple genes” part of Learn about cellxgene basical functions
Why the GSEA results different when I re-run
To reduce the time use, our GSEA run permutation 100 times, this increased variation of enrichment score calculation. In our tests, the exactly value might be different but the stable signal remains the same. We suggest use the GSEA plot as evidence. We will also implement the feature to allow user select permutation times later.
Why I encountered “Unexpected HTTP response 400, BAD REQUEST”
This usually happens because the group you tried to plot doesn’t contain samples. We went through many tests and tried to avoid this. You could also try open a browser using in private/incognito mode and let us know in Our Gitter Channel
Why I encountered “Unexpected HTTP error” or “Failure loading source”?
This usually happens when an user tried to plot his customized sample group annotation but didn’t add samples to that group. As tempory solution, please open a browser using in private/incognito mode and let us know in Our Gitter Channel
Why the download button for figures didn’t work
There are some technical difficulties to allow that feature due to the javascript plugin used. You could still download the high resolution svg figure using right-click -> “save image as”.
How do report bugs
Please let us know in Our Gitter Channel